Dashboard (Retail)
After a period of time, merchants can view various sales data in the CMS dashboard (Retail).
Open CMS Click to AnalyzeClick on Dashboard (Retail).
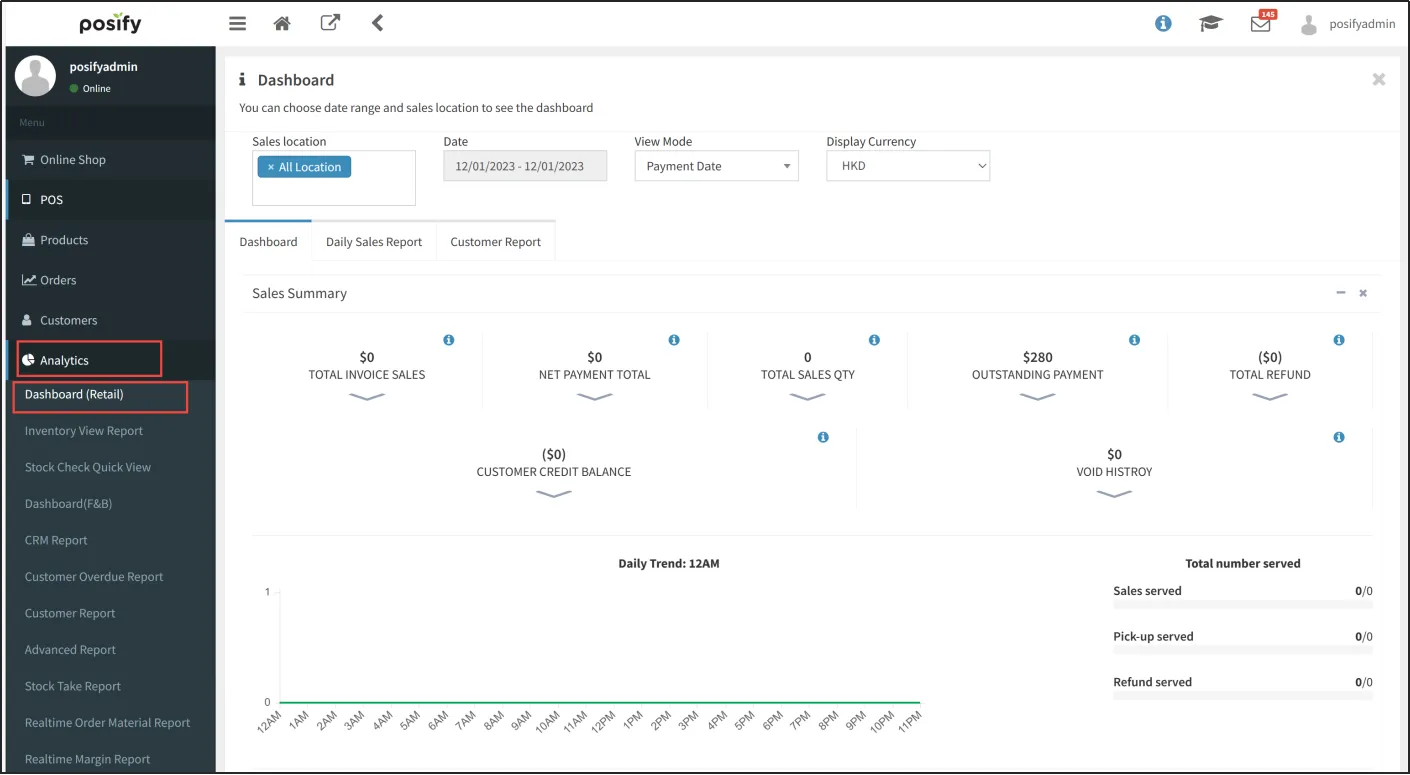
Merchants can select the range of sales and date and location to view the sales report.
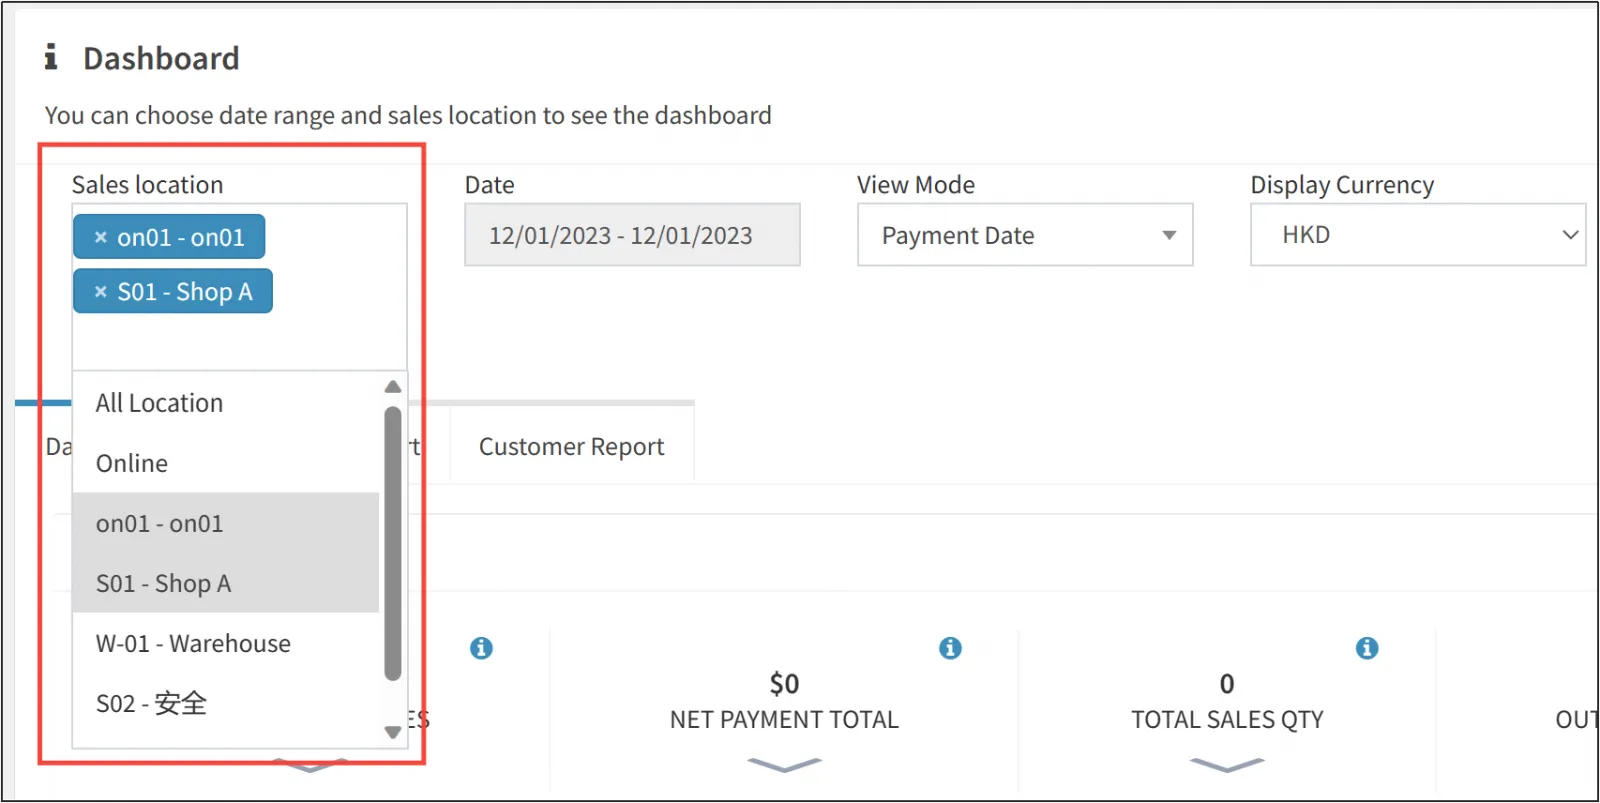
You can select one or more locations, or just select all of them.
Dates can be selected from a range of today, yesterday, the last 7 days, etc., or you can customize the start and end dates by selecting Custom at the bottom.
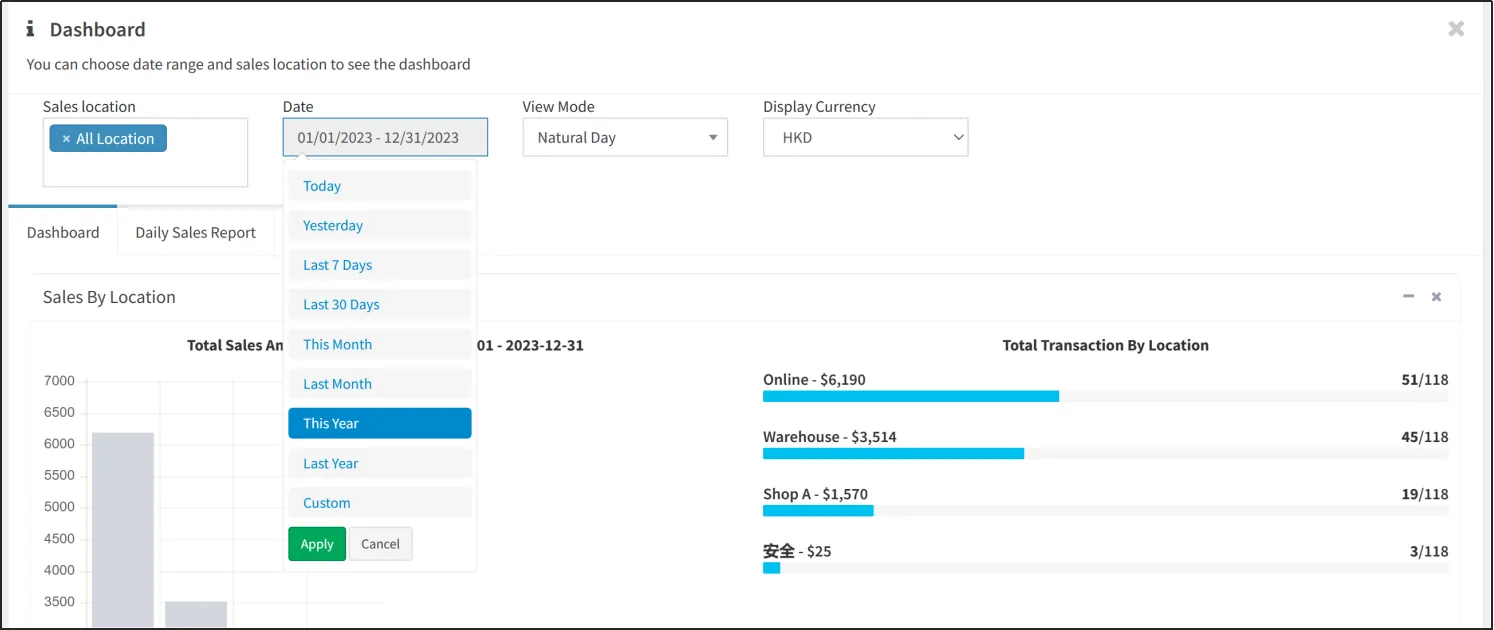
Select the view method and display currency again to start viewing the report below.
Dashboard
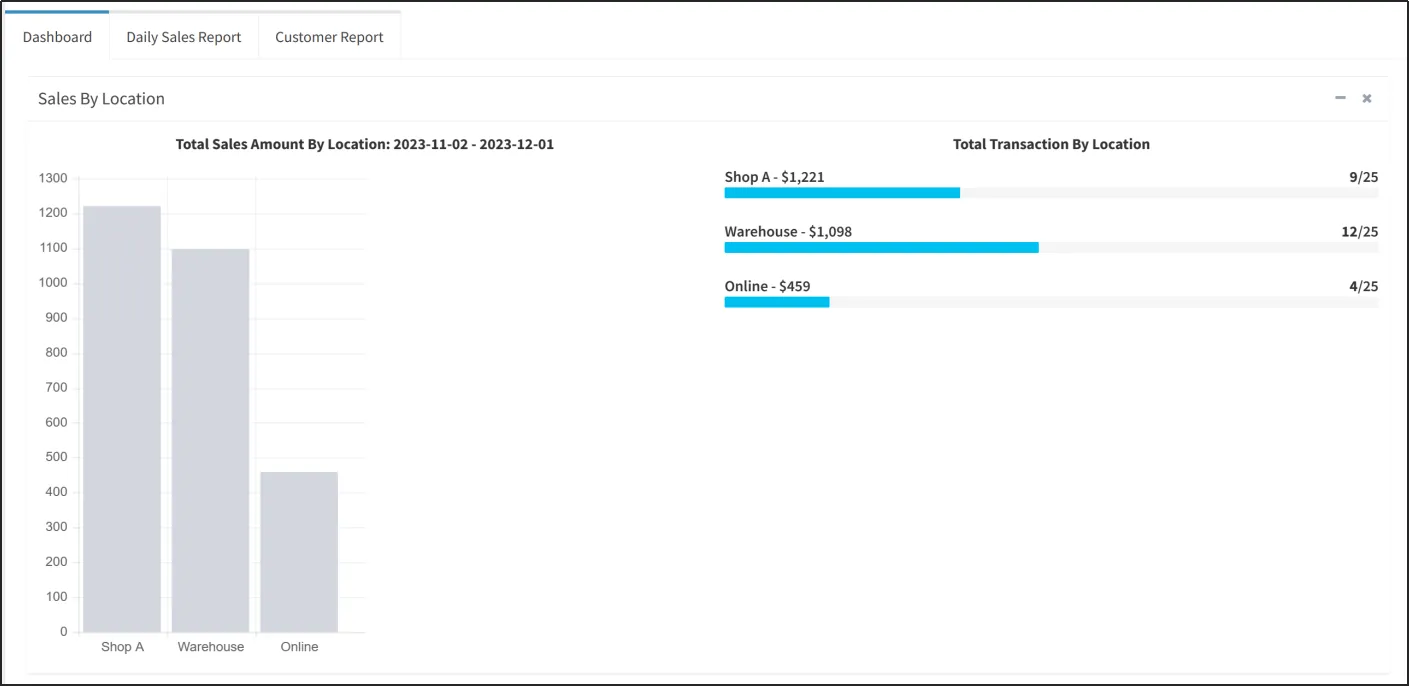
When selecting all locations, you can see the outlet sales under the dashboard.
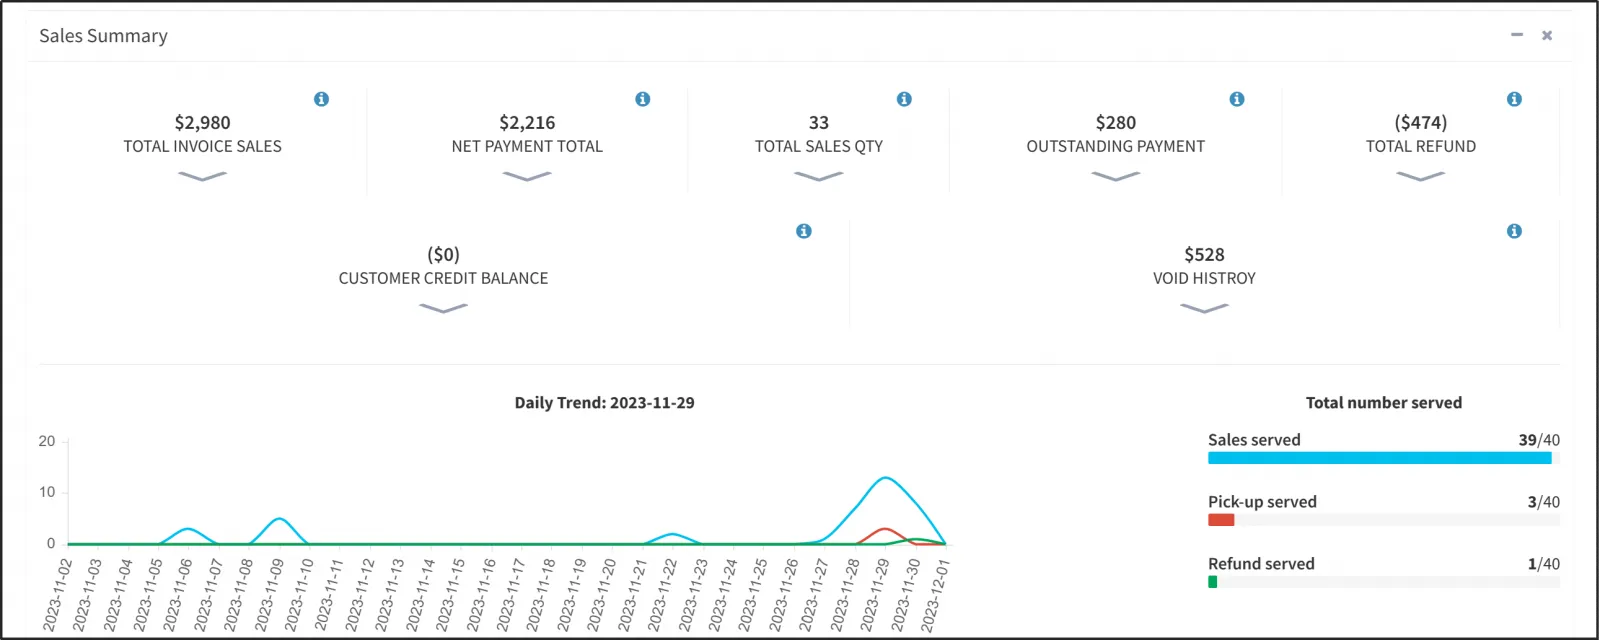
In the Sales Overview, you can see the order status of each type of sale, which includes information such as the number of orders, gross sales, net gross sales, and total sales.
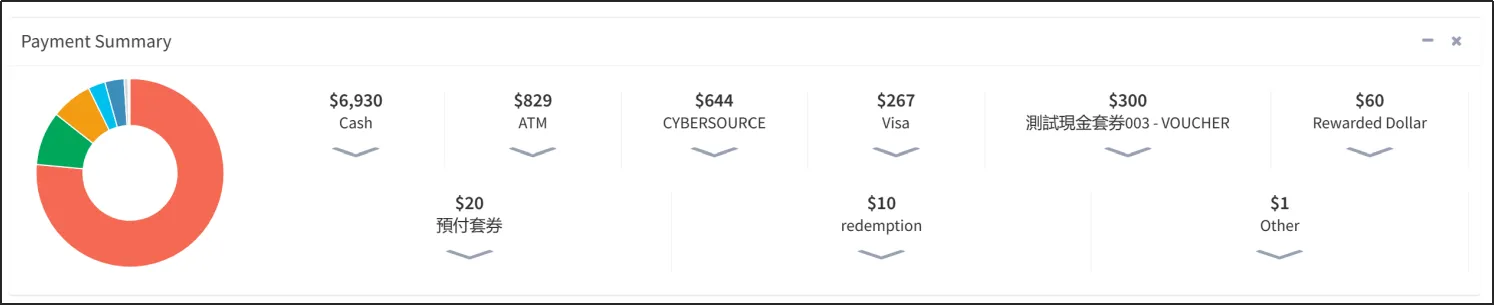
In the Collections overview, you can see the amount of money collected by the different collection methods and their percentage of the total amount collected (fan chart). By clicking on the arrows underneath a collection method, you can see the orders that have been collected through that collection method.
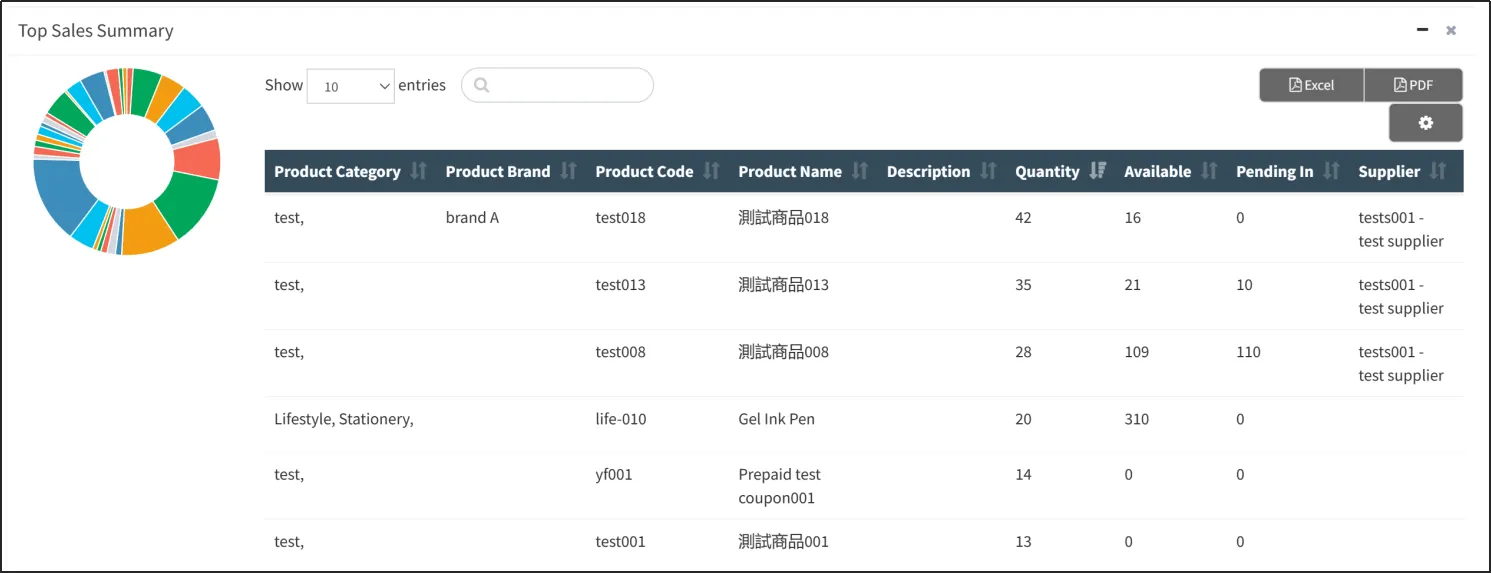
In the Hot Deals overview, you can see the most popular items for sale. In the list, you can see the level of popularity from the highest to the lowest, and there is a pie chart next to it, so the larger the area, the more popular the item is.
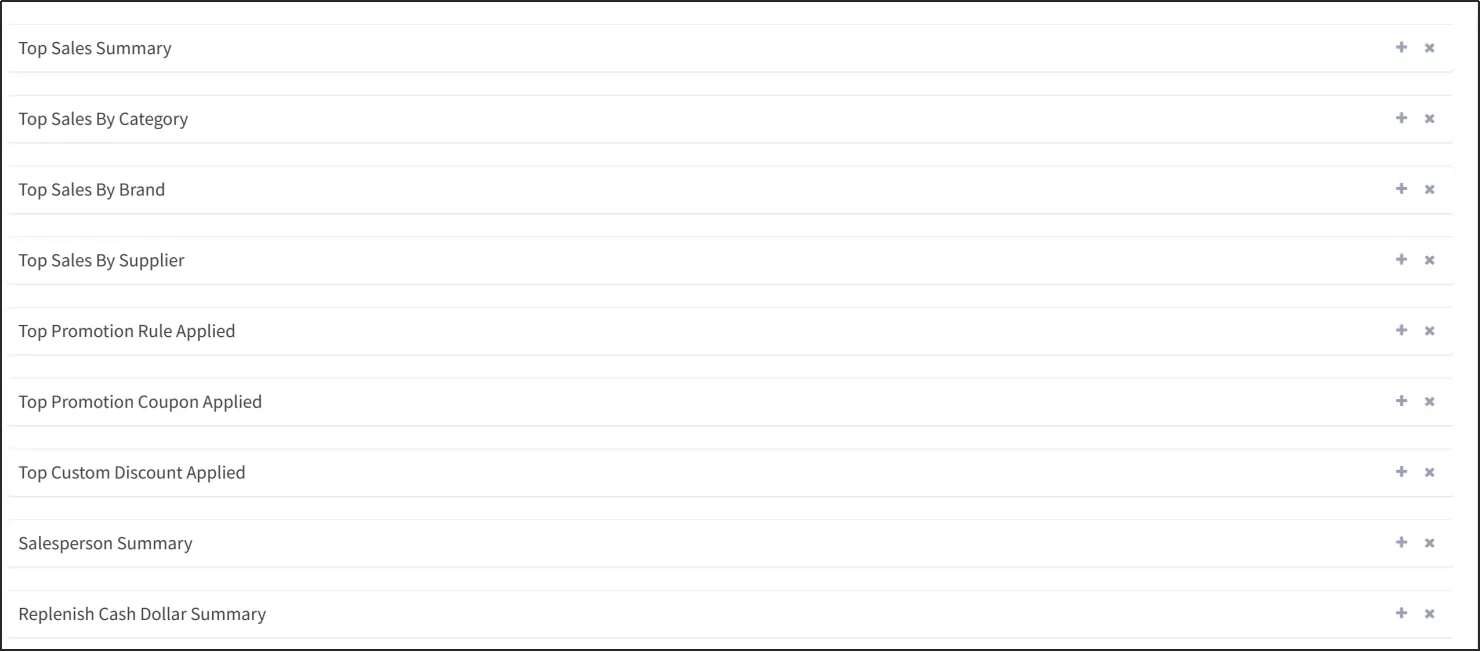
After that there are overviews of Hot Deals (by category), Hot Deals (by brand), Hot Deals (by supplier), Most Applied Discount Rules, Most Applied Coupons, Most Applied Custom Discounts and so on.
Day-end Report
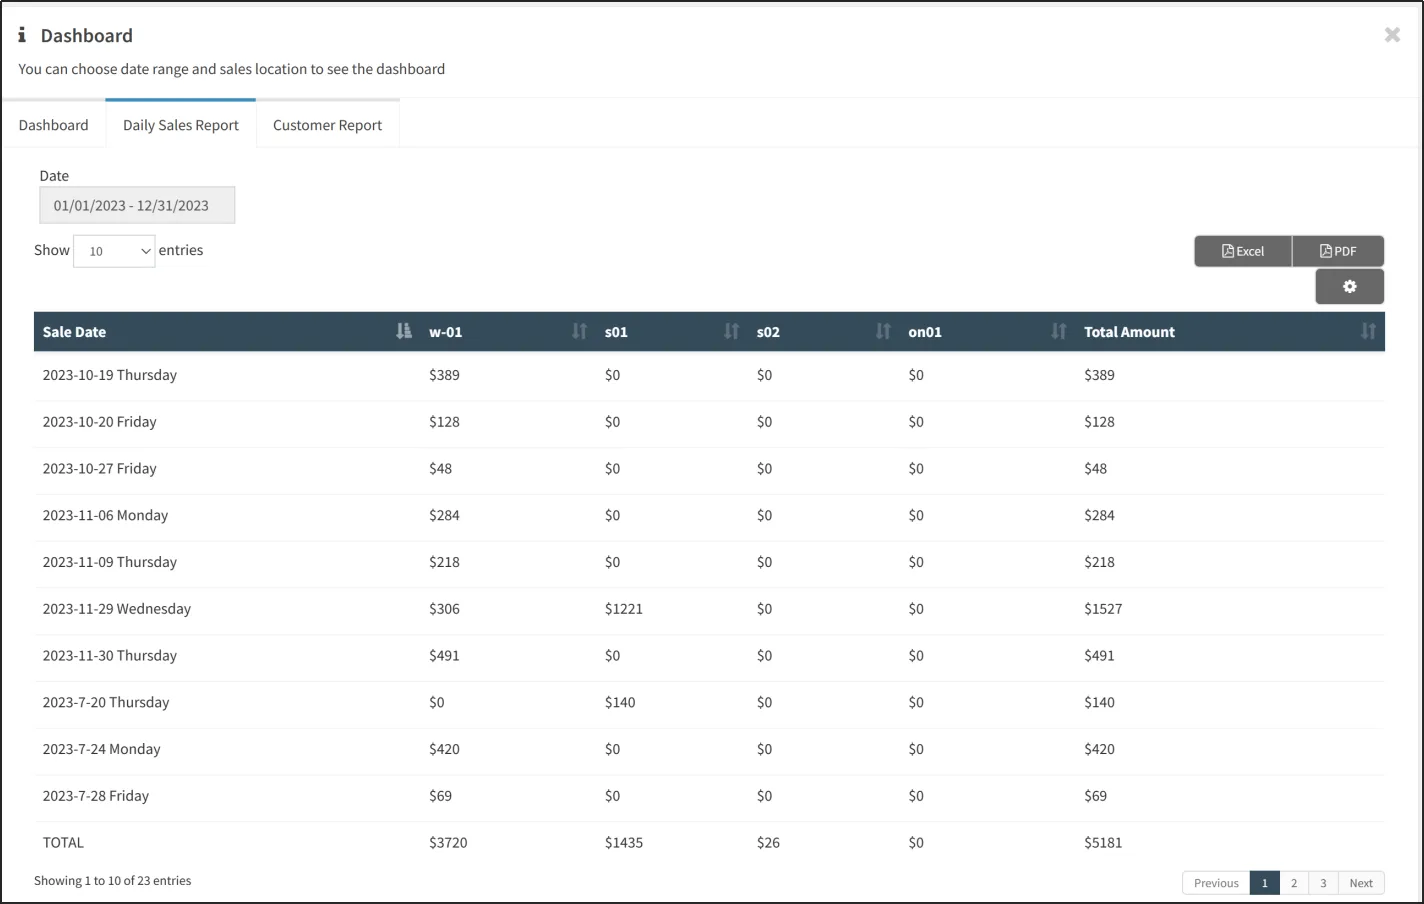
After selecting a date range in the Day End report, you can see the day end of sales for the dates in the date range that have sales records.
Client Reports
Under Customer Reports, select the sales location and date range to view the customer report.
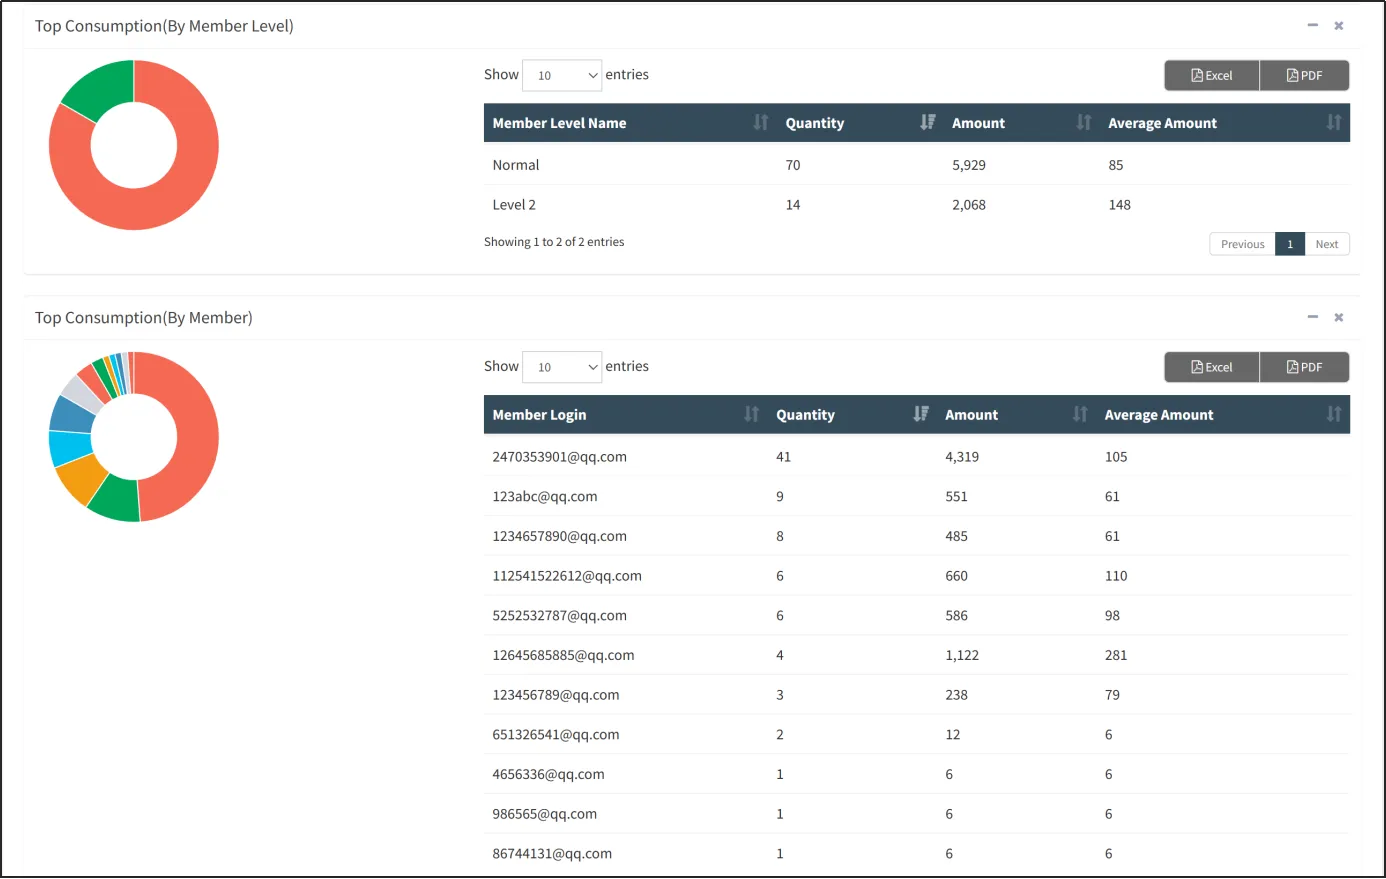
You can see the amount of money spent, the number of orders, and the average amount for different levels of members.
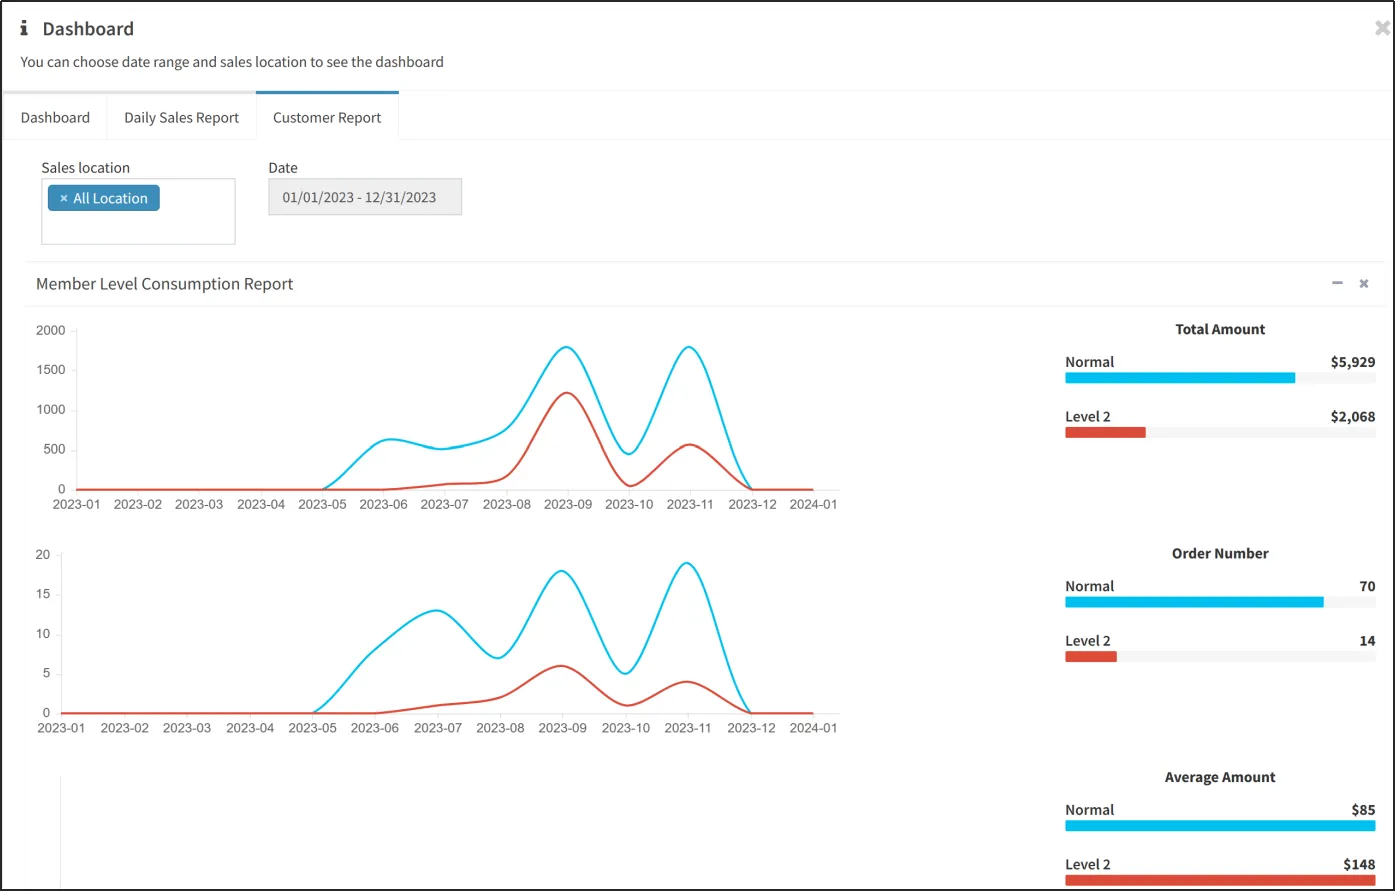
You can see the spending ranking of the member level, as well as the spending ranking among members.